Knowledge Base
Case Study
Network Performance Management (NPM)
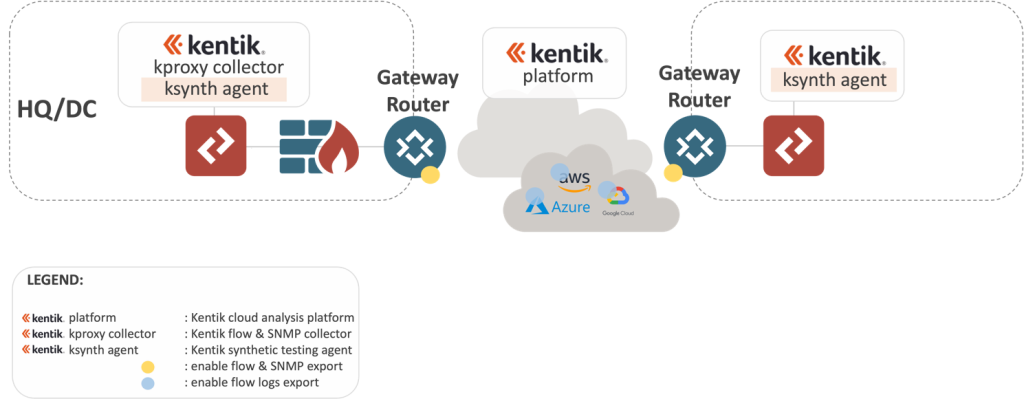
// via flow & SNMP
NETWORK OBSERVABILITY
01.
Capacity Planning
Ensuring that networks have adequate resources to handle current and expected future utilization.
02.
Network Troubleshooting
keeps all the data that teams need to understand what’s happening on the network and why.
03.
Insights & Alerting
Detection engine finds and generates insights that help teams prioritize issues by impact and importance.
- Mitigate DDoS Attack – fine-tune rules to catch early signs of traffic spikes or anomalous traffic behavior.
- Protect Against Botnets – analyze botnet traffic characteristics and trends over time and alert on significant changes in threat traffic volume, routes and source geo-locations.
- Identified Compromised Hosts – detect hosts using unexpected servers or services by using historical data to see points of ingress and lateral movement of threats.
- Test to/from Anywhere – to emulate the performance of applications for the users.
- The Path View – shows the multiple paths taken by your traffic, highlighting nodes and links with high latency and loss.
- The State of the Internet – monitor the state of SaaS applications, in and between public clouds and DNS service providers.
- Visualize Cloud – see what you’ve been missing for flow data, health metrics, and VPC connectivity.
- Optimize Cloud Services – determine the best deployment model and most efficient traffic patterns for your services.
- Migrate Apps Confidently – baseline application performance and understand security, capacity and geo-location impact before moving between clouds.

SLO vs SLI Overview
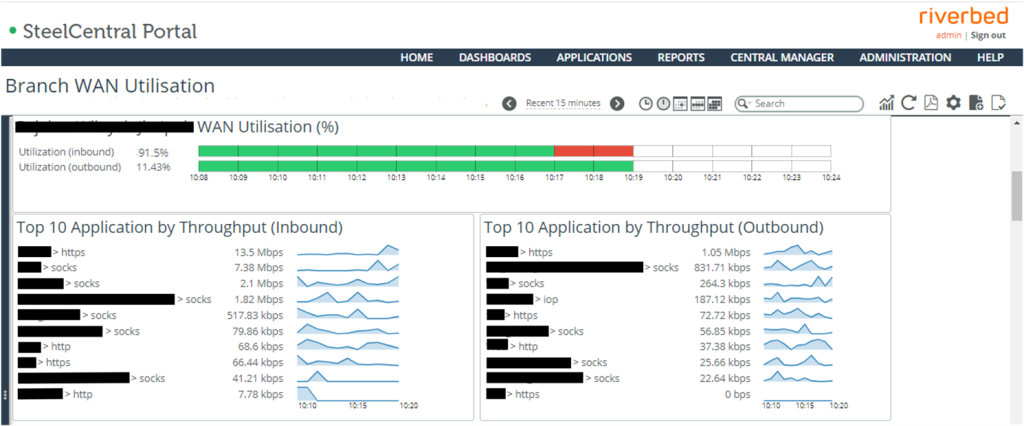
| Service Level Objective (SLO) | Utilization below 80% |
| Service Level indicator (SLI) | Utilization (%) |
| Good | < 80% |
| Warning | > 80% till 90% |
| Critical | > 90% till 100% |
As indicator to ensure the branch bandwidth utilization meet Service Level Objective (SLO) and Service Level Indicator (SLI).
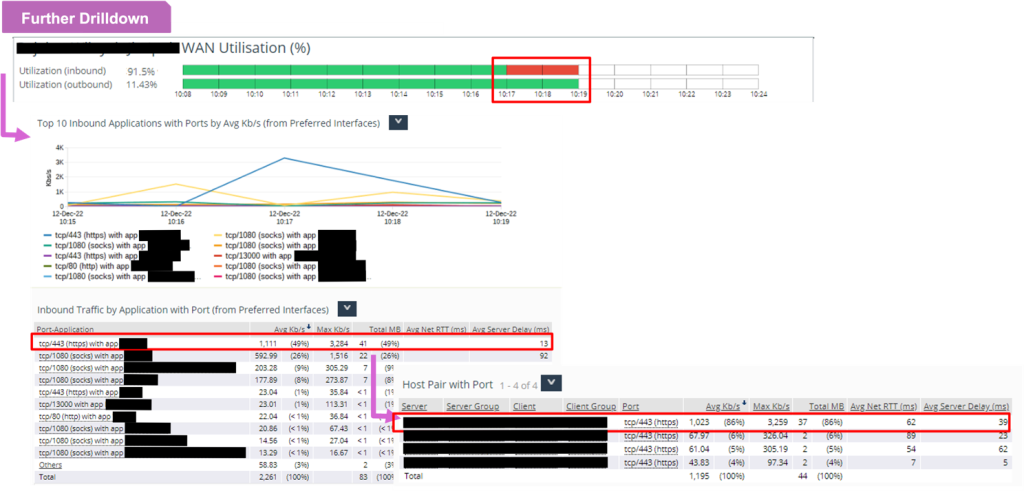
When the SLO and SLI are breach, further drilldown to investigate which application and which host pair and what metrics that contribute to the issue.
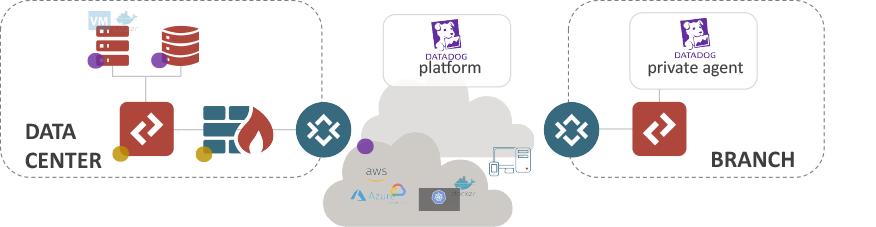
Application Performance Monitoring
Infrastructure
See inside any stack, any app, at any scale, anywhere
Log Management
Analyze and explore log data in context with flexible retention
APM & Continuous Profiler
End-to-end distributed tracing and always-on production code profiling
Database Monitoring
Surface slow performing queries and optimize application performance
Synthetic Monitoring
See inside any stack, any app, at any scale, anywhere
Network Monitoring
Analyze and explore log data in context with flexible retention
Application Security Management
End-to-end distributed tracing and always-on production code profiling
Real User Monitoring
Surface slow performing queries and optimize application performance
// FAQS
Frequently Asked Questions
Performance management is a corporate management tool that helps managers monitor and evaluates employees’ work. Performance management’s goal is to create an environment where people can perform to the best of their abilities and produce the highest-quality work most efficiently and effectively.
Network Performance Monitoring is the process of visualizing, monitoring, and optimizing, troubleshooting, and reporting on the health and availability of your network as experienced by your users. Network performance Monitoring (NPM) tools can utilize a different type of telemetry including:
- Device metrics, such as SNMP, WMI, CLI, API, logs, and synthetic tests.
- Network flow data, such as NetFlow, jFlow, IPFIX, etc.
- Packet data. Everything you do on a network requires packets; it carries data across the network.
The process of measuring important software performance parameters using monitoring software and telemetry data is known as application performance monitoring (APM). APM is used by professionals to guarantee system uptime, enhance user experiences, and optimize service performance and response times.
Common use cases for monitoring include commercial applications, the internet, and mobile apps. However, in today’s digitally interconnected world, monitoring use cases now include the services, hosts, processes, logs, networks, and end users who utilize these applications, such as clients and staff of a business.
Common use cases for monitoring include commercial applications, the internet, and mobile apps. However, in today’s digitally interconnected world, monitoring use cases now include the services, hosts, processes, logs, networks, and end users who utilize these applications, such as clients and staff of a business.
Observability provides deep visibility into a modern distributed system for faster, automated problem identification and resolution.
Observability is the extent to which you can understand the internal state or condition of a complex system based only on knowledge of its external outputs. The more observable a system, the more quickly and accurately you can navigate from an identified performance problem to its root cause, without additional testing or coding.
Observability is the extent to which you can understand the internal state or condition of a complex system based only on knowledge of its external outputs. The more observable a system, the more quickly and accurately you can navigate from an identified performance problem to its root cause, without additional testing or coding.
End User Experience Monitoring (EUEM) analyzes the performance of a user’s end-to-end workflow across multiple devices, networks, clouds, and applications with the goal of improving business productivity.
Infrastructure Monitoring is used to collect health and performance data from servers, virtual machines, containers, databases, and other back end components in a tech stack. Engineers can use an infrastructure monitoring tool to visualize, analyse, and alert on metrics and understand whether a backend issue is impacting users. In this article, we’ll explain how infrastructure monitoring works, its primary use cases, challenges to keep in mind, and tools to help you get started.
Actionable insight is a conclusion drawn from data that can be turned directly into an action or a response. The data informing the insight can be structured or unstructured, quantitative, or qualitative. While actionable insight provides the impetus for action, people, or processes are needed to execute the actions.
Actionable insight arises from one or more people analyzing raw data. Actionable insight can be derived from big data when large amounts of structured and unstructured data are involved.
Actionable insight arises from one or more people analyzing raw data. Actionable insight can be derived from big data when large amounts of structured and unstructured data are involved.
Performance Evaluation serves as a health check on operations and individuals’ work. The organizational maturity notion signifies the progress of an organization in terms of developing its people, processes, technology, and capability by implementing quality practices. Organizations aiming to achieve the highest maturity levels in performance need to take care of the intricacies involved in deploying a Performance Management system and the relationships it has with the other key organizational activities.
Performance Management processes in organizations can be assessed using maturity levels, by measuring the implementation of Performance Management tools, analysing the availability of internal Performance Management processes in place, and assessing the structures, procedures, and interactions utilized to direct Performance Management systems.
Performance Management processes in organizations can be assessed using maturity levels, by measuring the implementation of Performance Management tools, analysing the availability of internal Performance Management processes in place, and assessing the structures, procedures, and interactions utilized to direct Performance Management systems.